Last Updated on October 13, 2024
In the speaking section of PTE, tackling the “Describe Image” task can be pretty challenging, especially when describing image map charts. You’re given just 40 seconds to convey your thoughts, and to add to the complexity, 2 out of the 6 questions in this section might be related to maps. The quality of the image could sometimes be less than ideal, making the task even more tougher. You’ve come to the right place if you struggle to describe image map charts in PTE! So scroll down to clear all your doubts!
In essence, in the speaking section, PTE describes an Image task where you need to fluently describe various types of visuals, including graphs, charts, and maps. This blog offers a comprehensive guide on describing image map charts in PTE, along with tips and plenty of sample practice questions and answers to help you improve.
What is the PTE Exam?
PTE, or Pearson Test of English, is a computer-based examination for students aspiring to study abroad. The PTE Academic test evaluates a candidate’s English proficiency across four key sections: reading, writing, speaking, and listening. Applicants aiming to pursue higher education in countries where English is the primary language generally take this exam. The described image task is under the PTE speaking section.
PTE Describe Image Map Chart: Scoring Guide
The PTE describe image map chart task will be scored based on the following criteria:
Content
The content criterion is scored on a scale of 0 to 5. A high score of 5 is awarded to answers that cover all relevant parts of the image, including their co-relations.
The more the elements from the image you describe accurately, the higher your score will be. Including more than 12 items from the image in your response is satisfactory to get the total score in the Content category.
Pronunciation
Pronunciation is also scored on a scale of 0 to 5, with 5 indicating native-like use of the language and 0 for unrecognizable English. Accurate and clear pronunciation is essential to achieve a higher score in the pronunciation category.
Oral Fluency
As with pronunciation, oral fluency is also scored on a scale of 0 to 5. A score of 5 is given for natural and smooth speech without hesitations or pauses. Speaking fluently and confidently contributes to a better score in this aspect.
How to Describe Image Map Chart PTE?
In the PTE exam’s speaking section, candidates are evaluated on their ability to describe various images within the given timeframe, including graphs, tables, pictures, and maps. Each image is shown for 25 seconds, and the examinees have 40 seconds to describe fluently. However, applicants should be mindful of their responses as the maps presented may sometimes need more clarity. These maps can differ from ancient to political maps. Focusing only on the significant details they see on the map is essential to perform well within a brief time frame. As you have only 40 seconds to speak, make sure your description is crisp and clear, and be quick. For this, you can follow the suggested instructions given below:
- Candidates can begin their introduction in 1 or 2 lines by mentioning the map’s title or the background information, like the map’s type and purpose. For instance, like The map displays.., The given map shows..,
- In the description, talk about the three main features of the map, showcasing their significance. Describe the locations of features, using words such as on the left, to the right, etc. Identify important objects in color by saying that the city is marked blue, green, etc. To specify shapes and sizes, use words like small rectangle, most giant square, the most prominent building, etc.
- End with a conclusion in 1 or 2 sentences with the crucial finding in the map. Use lines like “ To conclude…, or rephrase the introduction like, Finally, The map offers valuable insights…”.
PTE Describe Image Map Chart: Practice Samples
Several samples are given below with corresponding answers to guide candidates on how to describe map chart PTE.
PTE Describe Image Map Chart – Practice Test 1
Sample 1 Answer
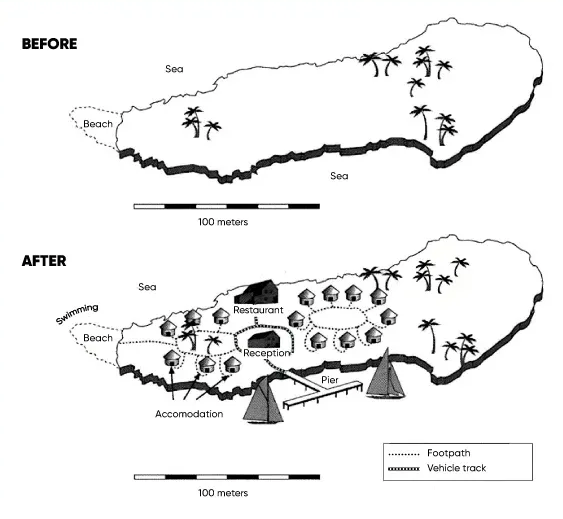
The given image illustrates how a once-natural island has become a tourist spot. This 100-meter-long island’s original features were a beach, palm trees, and tranquil surroundings by the sea. However, in the following image, we see significant development, such as lodgings, a restaurant, and swimming areas, all of which have been deliberately incorporated without significantly affecting the island’s natural resources. A short road now connects the restaurant and reception, and pathways connect other locations. In conclusion, tourism development has significantly changed the island, increasing congestion.
PTE Describe Image Map Chart – Practice Test 2
Sample 2 Answer
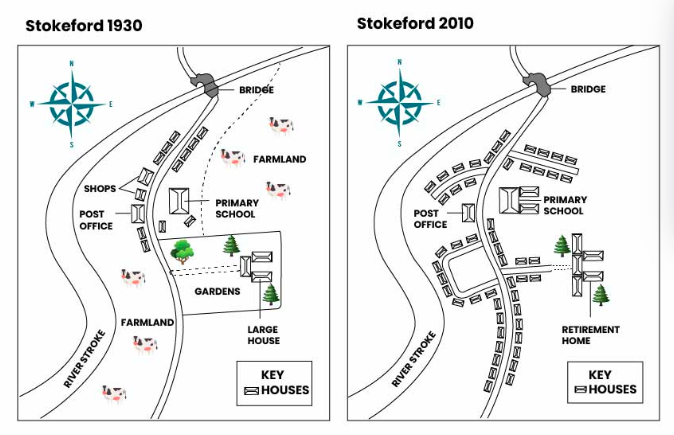
These two maps describe the development of the Stokeford village area from 1930 to 2010. A lot of changes have taken place in Stokeford village over 80 years. The shops and farmland located on the bank of River Stoke were destroyed, and many houses had been constructed till 2010. A few things were unchanged in the past 8 decades. These are River Stoke, a bridge, the post office, and the primary school. Moreover, two houses were built next to the primary school, as shown on the 2010 map. In conclusion, Stokeford has seen a massive change from 1930 to 2010 because all the farmland area was allocated to build more houses to meet the expanding population’s needs.
PTE Describe Image Map Chart – Practice Test 3
Sample 3 Answer
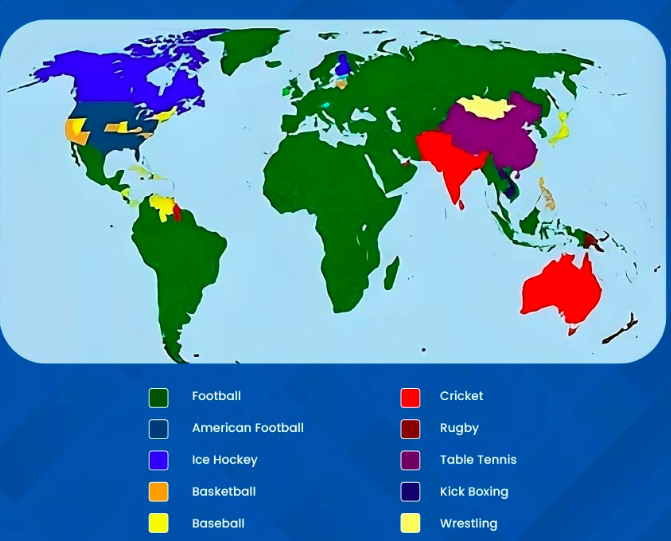
The map shows the participation of athletes in various sports across different continents. Countries like South America, Africa, and Asia witnessed the highest participation rates in football. On the other hand, North America had significant participation in Ice hockey and American football. Meanwhile, Cricket was popular in Australia and India. In addition to this, sports like Rugby, table tennis, kickboxing, and archery gained relatively lower popularity across all continents.
PTE Describe Image Map Chart – Practice Test 4

Sample 4 Answer
The provided image features two flags from different countries, and it’s interesting to note that they share the same red, green, white, and black hues. However, there are significant differences in their patterns. The first flag, which is situated above, displays a vertical rectangle in the leftmost corner, followed by upside-down green, white, and black stripes. In contrast, the second flag on the right replaces the rectangle with a triangular shape containing a white asterisk. Its stripe sequence is reversed compared to the first flag, running from top to bottom in black, white, and green. In conclusion, these two flags share brilliant colors but have different design patterns.
Tips to Describe PTE Image Map Chart Effectively
To get the highest score in the PTE exam, applicants should practice effectively with a well-defined strategy. Here are some practical tips for preparing for the PTE Describe image section.
- Speak clearly and fluently in the described image task.
- Prioritize punctuation, fluency, and vocabulary.
- Focus only on the significant findings and explain them briefly in the given 40-second time limit.
- If you want to score 80+ in the PTE exam, speak for over 30 seconds.
- Be sure to speak for over 30 seconds to score above 80 in PTE.
- Make sure to practice clearly describing the image, as it carries greater importance in the PTE Speaking section.
By honing your skills through disciplined practice and a deep comprehension of the Map chart PTE (describe image) task, you can become highly skilled at interpreting and effectively communicating information from any visual data, ultimately contributing to a commendable overall band score.
Conclusion
In conclusion, you learned about map chart PTE and how to answer it. Above all, there are four sample answers by experts. This shows how you have to cover all the features and provide a proper way to describe them. Not only this, but also you read the tips from the experts. It will help you ace the language test on the first attempt.
FAQs
Q. How do you explain a map in PTE?
Begin your explanation of the provided image with a concise introduction spanning 1-2 sentences. This introduction should include the map’s title, type, and intended purpose. Subsequently, proceed to offer a brief description of 4-5 sentences explaining the main points in the image. Conclude your explanation with a final 1-2 sentence summary, highlighting the key findings presented in the map.
Q. Is 50 PTE easy to score?
Getting a 50 or higher on the PTE is easy if you have average English speaking, reading, writing, and listening skills. If candidates use the appropriate techniques, anyone with above-average English can obtain a score of 50 or higher. You must start to practice 15 to 20 days before. You can use mock exams to track your progress.
Q. How can I use map chart practice samples to improve my Describe Image skills?
A straightforward way of practicing samples is to read them out aloud. When accessing the resources, read the sample loud instead of at a low pitch.
Q. How many types of graphs are there in PTE?
Bar graphs, Line graphs, and Pie charts are the 3 types of graphs in PTE.
Q. How many describe image questions in PTE?
Candidates can expect 6- 7 questions of this type during the examination. A duration of 40 seconds is given to explain the given image.

Linette Shoji is a seasoned content writer specializing in guiding students through the complexities of applying to universities abroad. Her well-researched, clear, and practical articles break down intricate information into easy-to-understand advice. Linette’s work empowers students to make informed decisions, ensuring a smooth and successful journey to higher education.
Source link
All Materials on this website/blog are only for Learning & Educational purposes. It is strictly recommended to buy the products from the original owner/publisher of these products. Our intention is not to infringe any copyright policy. If you are the copyright holder of any of the content uploaded on this site and don’t want it to be here. Instead of taking any other action, please contact us. Your complaint would be honored, and the highlighted content will be removed instantly.